Powered by AI, Built for Smarter Investing
🔍 1. Market Data
- Live prices & volume
- Earnings & news alerts
📊 2. Multi-scale Analytics
- Intraday & long-term trend ratings
- Momentum & price-acceleration scoring
⭐ 3. Ratings Engine
- Fundamental Strength Index
- Reward-to-Risk & Risk (%)
- Overbought/Oversold signal
🚀 4. PickWiseAI Dashboard
- Decision cards by symbol
- Live filters & sliders
- Expected price range & position
⏱️ Faster decisions with live data
🎯 Smarter trades with trend ratings & expected price ranges
🛡️ Lower risk with transparent signals
Key Metrics Explained
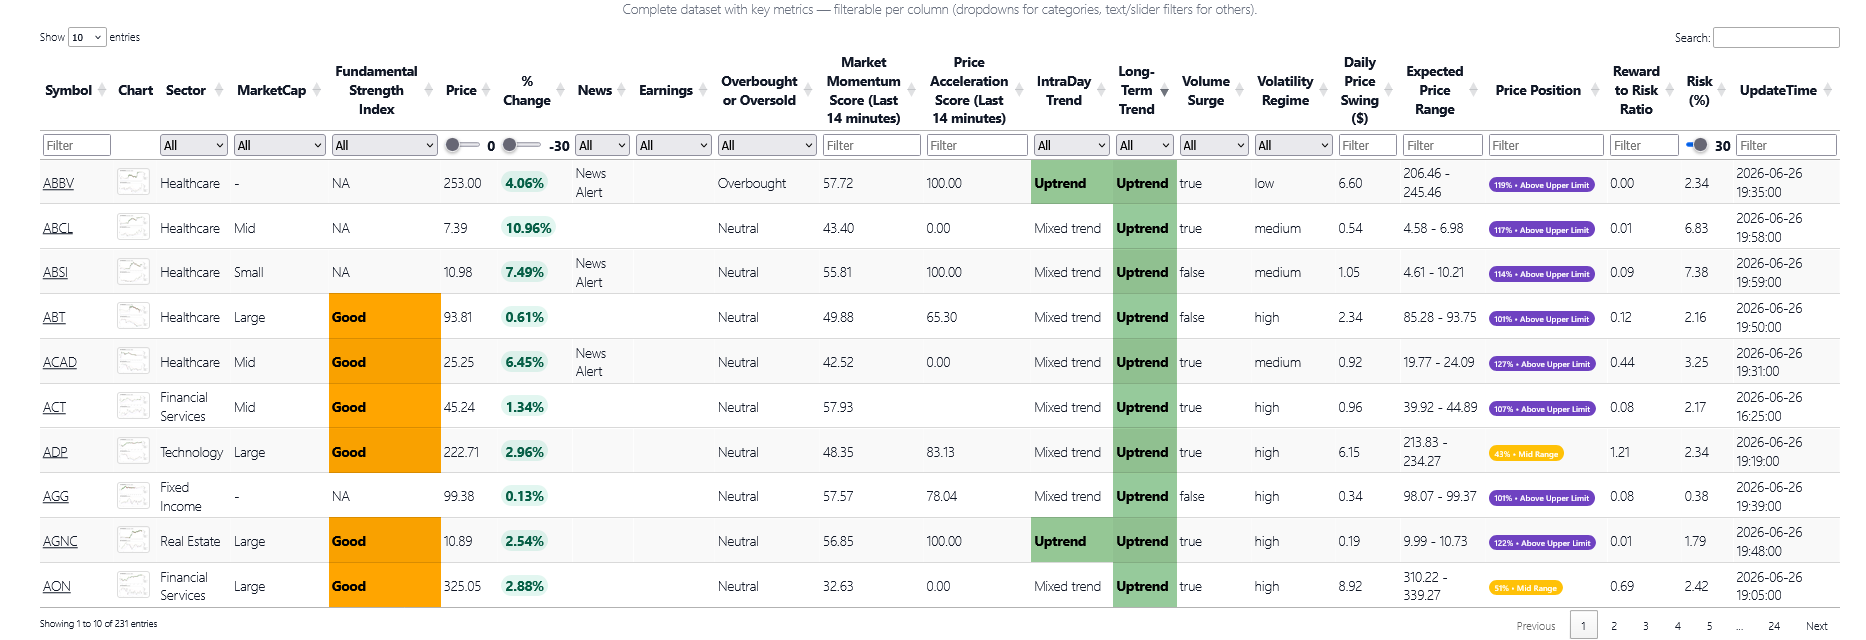
| Column | Description |
|---|---|
| Symbol | The stock or ETF ticker symbol (clickable for details on Yahoo Finance). |
| Chart | A small trend-chart thumbnail for the symbol. Click to open the full chart in a new tab; hover to preview it inline. |
| Sector | The industry sector the company or ETF belongs to (e.g., Healthcare, Technology, Financial Services). |
| MarketCap | Market Capitalization. Total value of a company’s outstanding shares of stock. Large Cap ($10 billion and above), Mid Cap ($2 billion to $10 billion), Small Cap ($300 million to $2 billion), and Micro Cap (Under $300 million). Risk and volatility increases with small cap stocks. |
| Fundamental Strength Index | Fundamental Strength Index (FSI) is a proprietary score developed by PickWiseAI that evaluates a stock’s core financial health (rated as Good, Moderate, or Poor). |
| Price | Price at the time of the last update. |
| % Change | Percent change versus the previous close. Shown in green when positive, red when negative. |
| News | Flags a recent notable news alert for the symbol. |
| Earnings | Flags a recent or upcoming earnings alert for the symbol. |
| Overbought or Oversold | Momentum classification based on RSI and Stochastic indicators. Overbought = sharp recent rise; Oversold = sharp recent decline. |
| Momentum Score (Last 14 minutes) | A short-term momentum score (RSI-based) measured over the most recent 14 minutes of trading. |
| Price Acceleration Score (Last 14 minutes) | A short-term acceleration score (Stochastic-based) measuring whether intraday price movement is speeding up or slowing down over the last 14 minutes. |
| IntraDay Trend | Short-term trend rating based on pre-market and intraday price movement (Uptrend, Mixed trend, or Downtrend). |
| Long-Term Trend | Longer-term trend rating based on roughly the past year of trading data (Uptrend, Mixed trend, or Downtrend). |
| Volume Surge | Indicates whether trading volume is higher compared to recent averages. |
| Volatility Regime | Classifies the symbol’s current volatility level as low, medium, or high, based on recent price swings. |
| Daily Price Swing ($) | The typical dollar-amount price swing over a trading day (Average True Range), useful for gauging how much a stock normally moves. |
| Expected Price Range | The lower-to-upper price band the model expects the symbol to trade within over the longer term. |
| Price Position | Shows where the current price sits within the Expected Price Range as a percentage, with a label such as “Lower Range,” “Mid Range,” or “Above Upper Limit.” |
| Reward to Risk Ratio | Potential upside divided by estimated downside risk. A ratio of 2.0 or higher means the potential gain is at least double the potential loss. |
| Risk (%) | % Risk represents the potential loss in value of a stock over a 1-day holding period, with 95% confidence. For example, if a stock has a Risk (%) of 3%, it means there is a 95% chance the stock will not lose more than 3% in a single day but a 5% chance that losses could exceed 3%. |
| UpdateTime | Timestamp of when this row was last refreshed with the latest data (shown in Eastern Time). |
How to Use PickWiseAI
- Use the column filters and sliders in the Full Table to narrow down to the stocks and ETFs that matter to you.
- Use MarketCap to filter by company size (large cap, mid cap, small cap, micro cap).
- Use Fundamental Strength Index (FSI) to filter by a company’s financial health — Good, Moderate, or Poor — based on earnings, valuation, profitability, cash flow, and debt levels.
- Combine Long-Term Trend and IntraDay Trend to see whether a symbol’s short-term and long-term direction agree or conflict.
- Use Volume Surge together with the trend ratings to spot symbols with unusual activity backing up their momentum.
- Use Price Position and Expected Price Range to see whether a symbol is trading near the bottom, middle, or top of its expected band.
- Use Momentum Score and Price Acceleration Score (both over the last 14 minutes) to gauge short-term intraday strength.
- Use Reward to Risk Ratio and Risk (%) together to favor setups with a larger potential gain relative to potential loss, while avoiding the most volatile names.
- Open any stock card from the Market Insights, Highest Expected Gains, or other dashboard tabs for a deeper breakdown — Decision Summary & Alerts, Price Strength & Momentum, Opportunity & Risk, Price Level, and Context — for that symbol.